By Amanda Reeds, Content Researcher ·
Quick Summary
- Key Takeaway: Most lenders cap your home purchase around 3 to 4.5 times your gross salary, adjusted for debt and down payment.
- Who This Is For: First-time buyers and anyone comparing salary levels against 2026 mortgage rates before house hunting.
- Why It Matters: Knowing your real ceiling before you shop keeps you from falling for a home you can’t actually sustain.
- Reading Time: ~9 minutes
Why Getting This Number Right Is Worth Getting Right
You’ve probably scrolled real estate listings and felt the gap. What looks nice online rarely matches what your bank account can handle. It’s a common moment, and almost every buyer hits it. The listing price alone tells you nothing about whether the monthly payment will fit your life.
How much house you can afford depends on your gross income, monthly debt, down payment, and current mortgage rate. Most lenders use the 28/36 rule. Your total housing payment should stay under 28% of gross monthly income. All debt combined, including that payment, should stay under 36%. At a 6.49% rate, a $100,000 salary supports roughly a $370,000 home with no other debt.
Home affordability is a calculation, not a feeling. It measures the maximum home price your income, debt, and down payment can support without leaving you house poor. Lenders, financial planners, and mortgage underwriters all use some version of this math. You can run the same numbers yourself before you ever talk to a bank.
You’ll also see this idea called “buying power” or estimated through a mortgage pre-approval. They’re closely related but not identical. Pre-approval reflects what a specific lender will hand you after reviewing your credit and paperwork. Affordability, the number this guide walks through, is what you can sustain comfortably, which is often lower than what you’d technically qualify for.
See What You Can Actually Afford →
Table of Contents
- Why Getting This Number Right Is Worth Getting Right
- The 28/36 Rule Lenders Actually Use
- How to Calculate Your Own Number, Step by Step
- How Much House You Can Afford by Salary
- Two Real-World Examples
- Common Mistakes People Make
- Why Running the Numbers First Actually Helps
- Conventional vs. FHA Down Payments
- Frequently Asked Questions
The 28/36 Rule Lenders Actually Use
The 28/36 rule caps your housing payment at 28% of gross monthly income. It caps total debt, including that housing payment, at 36%. According to the Consumer Financial Protection Bureau, this debt-to-income ratio is one of the main factors lenders weigh. It shapes how much they’ll actually let you borrow, sometimes more than your income alone.
The “28” is your front-end ratio. It covers principal, interest, property tax, homeowner’s insurance, and any HOA dues. Lenders often shorten that group of costs to PITI. The “36” is your back-end ratio. It folds in everything else you owe monthly: car payments, student loans, credit card minimums, personal loans.
Here’s the part most people get wrong. They calculate the 28% number, feel good about it, and never check the 36%. A $500 car payment and $300 in student loan payments eat into your housing budget fast. That’s true even if your income looks strong on paper. Whichever ratio produces the lower housing payment is the one that actually governs what you can borrow.
It’s worth saying plainly: 28/36 is a guideline, not a law. Some lenders approve borrowers with a back-end ratio of 43% or higher. A strong credit score or a larger down payment often makes that possible. Even so, approval and comfort aren’t the same thing, and that distinction matters more than most guides admit. Treat the rule as a starting ceiling, then adjust based on your own comfort with monthly cash flow.
How to Calculate Your Own Number, Step by Step
Start with your gross monthly income. Then work through your debt and down payment to land on a realistic home price. Here’s the sequence lenders use, in an order you can follow with a pen and a calculator.
- Find your gross monthly income. Divide your annual salary by 12. A $90,000 salary equals $7,500 per month before taxes.
- Multiply by 28%. That’s your maximum front-end housing payment. For $7,500, the ceiling is $2,100.
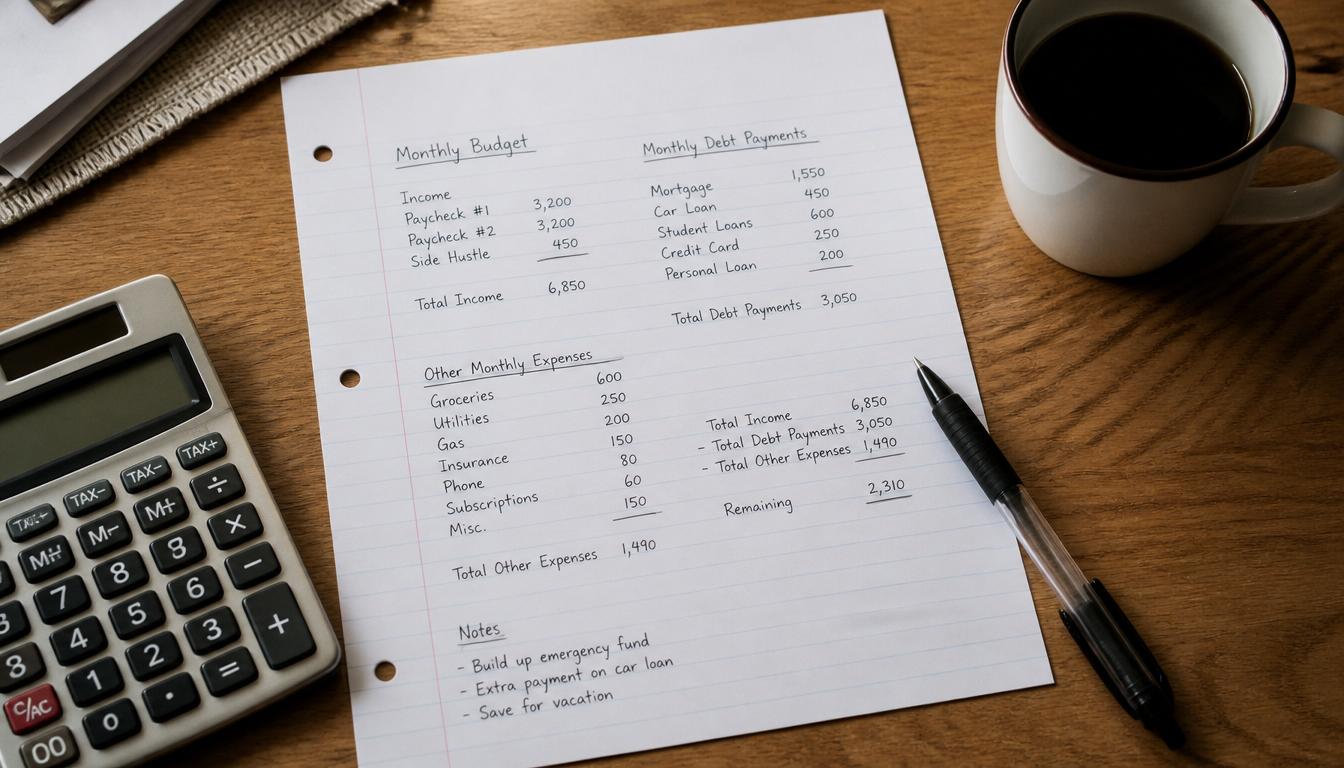
- List your existing monthly debt. Add up car loans, student loans, and minimum credit card payments.
- Multiply your income by 36%, then subtract your debt. This gives your back-end housing ceiling. If your debt is $400, that’s $2,700 minus $400, or $2,300.
- Take the lower of the two numbers as your true maximum housing payment.
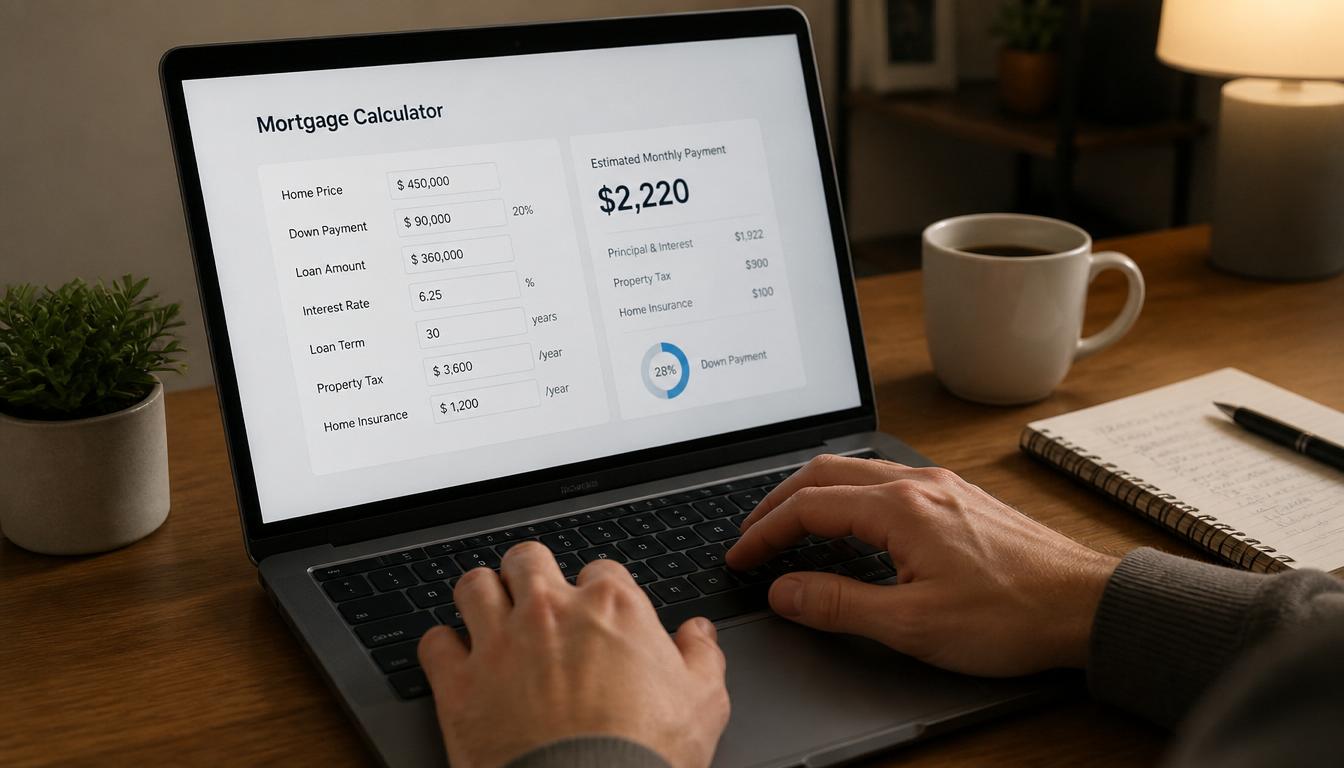
- Work backward through a mortgage calculator using your down payment and today’s interest rate to see what home price that payment supports.
Here’s the math applied. Say your monthly income is $8,333 and your debt-free housing ceiling is $2,333. That’s a 28% ratio at a 6.49% interest rate. On a 20% down payment, it translates into roughly a $372,800 home. That splits into a $298,200 loan and a $74,600 down payment.
Quick Action Steps
- Pull your last two pay stubs to confirm your true gross monthly income.
- List every recurring debt payment, not just the big ones.
- Decide on a realistic down payment based on actual savings, not a hoped-for bonus.
- Run your numbers through our mortgage calculator using today’s rate.
How Much House You Can Afford by Salary
The table below assumes a 20% down payment and no other monthly debt. It uses a 30-year fixed loan and the 6.49% average rate Freddie Mac reported for the week of July 9, 2026. Your actual number will shift with your local property tax rate, credit profile, and existing debt.
| Annual Salary | Max Monthly Housing Payment | Approx. Home Price |
|---|---|---|
| $70,000 | $1,633 | $260,900 |
| $80,000 | $1,867 | $298,200 |
| $100,000 | $2,333 | $372,800 |
| $120,000 | $2,800 | $447,300 |
| $150,000 | $3,500 | $559,100 |
| $200,000 | $4,667 | $745,500 |
Notice how the home price tracks close to 3.7 to 3.75 times salary across every income band. That holds true once debt is zero and the down payment stays at 20%. The ratio drops fast the moment you add debt or shrink the down payment. That’s exactly what the next section walks through, using two buyers at nearly identical incomes.
Two Real-World Examples
Maria, a 32-year-old nurse in Ohio, earns $100,000 a year with no car payment or student debt. She had saved enough for a 10% down payment. Her 28% front-end ratio put her maximum housing payment at $2,333 a month. That supports a home price near $338,600, split into a $304,700 loan and a $33,900 down payment.
David, a 29-year-old software support technician, earns $85,000. He carries a $650 monthly total between a car loan and two student loan payments. That debt pulled his back-end ratio below his front-end ceiling. His salary alone would allow roughly $1,983 a month. Instead, his real ceiling landed at $1,900, supporting a home price closer to $263,600 with a 5% down payment.
Same rough income bracket, a $75,100 gap in buying power. The difference wasn’t Maria’s salary. It was David’s monthly debt quietly eating into what looked, at first glance, like a comparable budget.
Common Mistakes People Make
Most affordability miscalculations come from a handful of repeat offenders. Here’s where buyers tend to lose the thread.
Ignoring existing debt. It’s tempting to focus only on the 28% front-end number, since it produces a bigger, more appealing home price. But your lender will run the 36% back-end ratio regardless. If you’re carrying car payments or student loans, that’s usually the number that actually caps you. Check the impact of existing loans on your borrowing capacity before you fall for a listing that’s out of reach.
Forgetting taxes and insurance. A lot of first-time buyers calculate affordability off principal and interest alone. Then they get surprised when property tax and homeowner’s insurance add hundreds of dollars to the actual bill. Property tax rates vary widely by county and state. PITI, not just P&I, is the number that matters.
Treating your pre-approval amount as a target. A pre-approval reflects the maximum a lender will hand you, not what fits comfortably into your life. Plenty of buyers stretch to that ceiling and end up house poor within a year.
Skipping PMI on low down payments. Anything under 20% down usually triggers private mortgage insurance. It adds a real monthly cost, and it sticks around until you build enough equity to cancel it.
Comparing US income multiples to other countries. You may have seen affordability questions framed around UK or Canadian mortgages. Lending standards, tax treatment, and typical income multiples differ meaningfully by country. The figures in this guide reflect US lending norms. Don’t apply them directly to a UK or Canadian mortgage application.
⚠ Watch Out For This
A high front-end ratio can look fine on paper while your back-end ratio, once you add debt, pushes you well past what a lender will actually approve.
Why Running the Numbers First Actually Helps
Knowing your real ceiling before you start touring homes changes how you shop. You stop wasting weekends on listings above your range. You also walk into a lender’s office with a number you already understand, instead of one they hand you cold.
It also protects your cash flow after closing day. According to the US Census Bureau and Department of Housing and Urban Development, the median sales price of new houses sold in the US reached $424,900 in May 2026. Existing homes ran even higher, at a median of $440,600 that June, per the National Association of Realtors. Those are national medians, and your local market may sit well above or below them. Buying below your maximum, rather than right at it, leaves room for maintenance costs and rate changes a median-price calculation doesn’t capture.
- You negotiate from a position of clarity instead of hope, because you know your true ceiling before an agent shows you a listing.
- You avoid the debt-to-income surprise that derails many buyers late in the mortgage approval process.
Conventional vs. FHA Down Payments
Your down payment size changes both your monthly payment and whether PMI applies. Here’s how a $350,000 home compares under two paths: a conventional loan at 20% down, and an FHA loan at 3.5% down. Both use a 6.49% rate over 30 years.
| Factor | Conventional (20% Down) | FHA (3.5% Down) |
|---|---|---|
| Down Payment | $70,000 | $12,250 |
| Loan Amount | $280,000 | $337,750 |
| Principal & Interest | $1,768/mo | $2,133/mo |
| Mortgage Insurance | $0/mo | ~$155/mo |
| Total Monthly PITI | ~$2,191 | ~$2,710 |
The FHA route gets you into the same house years sooner, in terms of savings time needed. But it costs roughly $519 more per month once mortgage insurance is added in. Whether that trade makes sense depends on what you value more: moving in sooner, or a lower monthly payment. Compare both paths directly using our loan calculator walkthrough before deciding.
💡 Pro Tip
Once you’ve settled into your mortgage, run extra payment scenarios through a mortgage payoff calculator to see how much interest you can cut by paying a little extra each month.
Frequently Asked Questions About How Much House You Can Afford
How much house can I afford based on salary?
As a starting point, multiply your annual salary by roughly 3 to 4.5. The exact multiple depends on your down payment and existing debt. On a $100,000 salary, that lands between $300,000 and $450,000. The more precise method uses the 28/36 rule. Cap your total housing payment at 28% of gross monthly income, and all debt at 36%, per Consumer Financial Protection Bureau guidance.
How much house can I afford with a $100,000 salary?
With a $100,000 salary, no other monthly debt, and a 20% down payment, you can typically afford a home around $372,800 at a 6.49% rate. That assumes a monthly housing payment near $2,333, or 28% of your $8,333 gross monthly income. Existing debt, taxes, and local insurance rates will shift this number.
What is the 28/36 rule for home affordability?
The 28/36 rule is a lending guideline. Your housing costs shouldn’t exceed 28% of gross monthly income. Your total debt, including housing, should stay under 36%. Lenders use it to gauge repayment risk. It’s a guideline rather than a legal requirement, and some lenders approve borrowers above these thresholds.
How much house can I afford based on monthly payment?
Start with the monthly payment you can comfortably manage, then work backward. Say you can pay $2,000 a month toward principal, interest, taxes, and insurance. At a 6.49% rate with 20% down, that supports roughly a $315,000 home. A mortgage calculator lets you test different payment ceilings against loan terms directly.
How much house can I afford with a $70,000 salary?
On a $70,000 salary with no other debt and a 20% down payment, you can typically afford a home around $260,900. That’s at current mortgage rates near 6.49%. It reflects a monthly housing payment near $1,633, the 28% threshold on $5,833 in gross monthly income. Reducing debt or raising your down payment can shift this higher.
Does my credit score affect how much house I can afford?
Your credit score doesn’t directly set a home price ceiling. It changes the interest rate you qualify for, and that changes your buying power. A lower rate stretches your budget further, since more of each payment goes toward principal instead of interest. Lenders also treat credit history as a compensating factor when debt ratios run high.
How much house can I afford with a $150,000 or $200,000 salary?
At $150,000, with no other debt and 20% down, expect a ceiling near $559,100. At $200,000, that rises to roughly $745,500. Both figures assume a 6.49% rate and the 28% front-end threshold. Existing debt, a smaller down payment, or a higher local tax rate will lower these numbers.
What income do I need for a $500,000 home?
To comfortably buy a $500,000 home with 20% down, that’s a $400,000 loan, you generally need a gross annual income near $134,000. At a 6.49% rate, that income keeps your housing payment near 28% of gross monthly pay. A smaller down payment or a higher local tax rate raises the income you’d need.
Content Researcher · AceCalculator
Amanda Reeds researches and writes AceCalculator’s personal finance and homebuying guides, translating lender underwriting standards like the CFPB’s debt-to-income guidance into plain-language calculations readers can run themselves. She focuses on grounding every figure in verifiable, current data rather than rules of thumb alone.
The Bottom Line on How Much House You Can Afford
Your real number comes from three inputs working together: gross income, existing debt, and down payment, run against current interest rates through the 28/36 rule. A $100,000 salary with no debt supports a very different home price than that same salary carrying $650 in monthly payments. Both buyers might feel equally “ready” to shop. Only one of them actually is.
What this math can’t tell you is how a specific payment will feel once you’re also covering groceries, childcare, or a job change. Treat your calculated ceiling as a starting point for a conversation with a lender, not a guarantee of comfort. Run your own scenario. Then adjust the down payment and debt inputs until the number matches your actual life, not just your income.
Compare Your Loan Options Now →